TL, DR
Columns or fields truncation when visualizing Pandas DataFrames can be annoying. Exporting data views for use in other contexts (such as a blog post) may also not be immediate. Using Pandas options and the dataframe-image package we can easily visualize DataFrames in their full extent (without columns of fields truncation) and save this view as image for other uses. There is an extra option to be set for exporting in case we use Google Colab.
Update
You may also want to check those other exporting options for Pandas DataFrames:
Visualizing your data
Pandas DataFrames are one of the most used tools to handle tabular data for data science. When we use them to organize our data we often want to have a look to a few rows to get a sense of what’s inside. However, if our data is particularly large, we can get some challenge link in the example below.
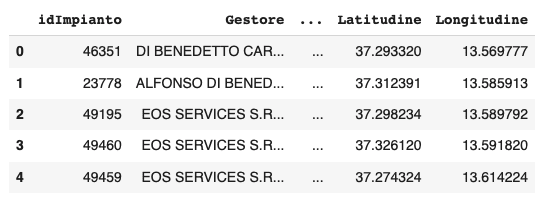
We clearly see that the column “Gestore” has truncated fields, where we can only see some characters. There are also more columns between “Gestore” and “Latitudine” which have not been displayed.
Luckily, we can easily solve this hiccup and get a full view of our data with a few commands. For the purpose of this guide we will use Google Colab as the reference environment, but commands will work quite similarly in any other Jupyter Notebook environment. Let’s begin expanding our columns view to include all fields. You need to type the following command in a cell and run it:
pd.set_option("display.max_column", None)Next time we will print out our table we will see many more columns. However, some of them will still be displaying a truncated field and we will not be able to see them in their full extent. To fix this as well, we need to run the following command:
pd.set_option("display.max_colwidth", None)This way, we will be able to see all fields in their full extend. There are two more commands that can help us to have a better view of our data:
pd.set_option('display.width', -1)
pd.set_option('display.max_rows', None)
The first one will help us to expand our table across all the available view. (even if documentation says it only works in a terminal environment. In case it does not work for you, you can set another integer number and that will be the number of characters of width for the current view). The second one will help us to view more rows, in case we got the same truncation issue we had with columns before.
Exporting the view as image
Now we have the view of our data as we want. And we want to use it somewhere else. It can be a blog post, a Word document, or anything else. The usual old shortcut would be to grab a screenshot and copy/paste it wherever we want.
However, for some more official document where we plan to use multiple tables, a little bit more consistency in formatting would be appreciated.
Also for this point, we can easily solve our issue with a handy Python library and one command. The library is called dataframe-image. We can use it to support exporting all our Jupyter notebook, or just for transforming one or more DataFrame views in PNG images.
This is what you need to do in order to export the data in your data_df Pandas DataFrame into an image named “table.png”:
import dataframe_image as dfi
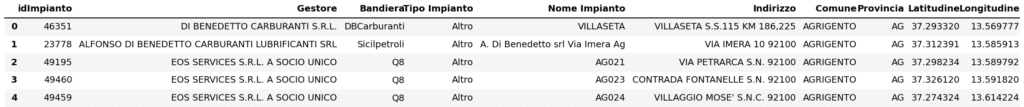
dfi.export(data_df, "table.png")If you are using Google Colab, the code above will give you an error, since the environment lacks the Chrome executable used by default by the dataframe_image library. To fix this, we can set the backend for image conversion to matplotlib in the following way:
dfi.export(
    data_df,
    "table.png",
    table_conversion="matplotlib"
)
And this is the result from the export procedure:
We can also apply some style to our Dataframes, like highlighting maximum / minimum values or changing the background colors. For instance, the following command will create a new styled DataFrame from our data_df DataFrame, highlighting the maximum value in the “Longitudine” and “Latitudine” columns, and export it as a new PNG image:
styled_df = data_df.style.highlight_max(
        subset=["Latitudine", "Longitudine"])
dfi.export(
    styled_df,
    "styled_table.png"
)
However, at the moment if we use the matplotlib backend any formatting is lost during exporting. See the status of the issue on Github here.
Related links
- dataframe-image library link
- Pandas set_option documentation link
- Pandas DataFrame.style documentation link
- Export Pandas DataFrames to Latex link
- Export Pandas DataFrames to HTML tables link
Do you like our content? Check more of our posts in our blog!